Lesson 2: Level Change
31 Topics
Lesson 3: Slope Change
45 Topics
Lesson 4: Putting It All Together
26 Topics
Mastering the Basics of Visual Analysis by Katie Wolfe and Timothy A. Slocum is © 2015-2024 FoxyLearning LLC and distributed under CC BY-NC-SA


; 3.42 Detecting a Change in Slope with Greater Variability
This is the open-access version of this module and your progress is not tracked or recorded
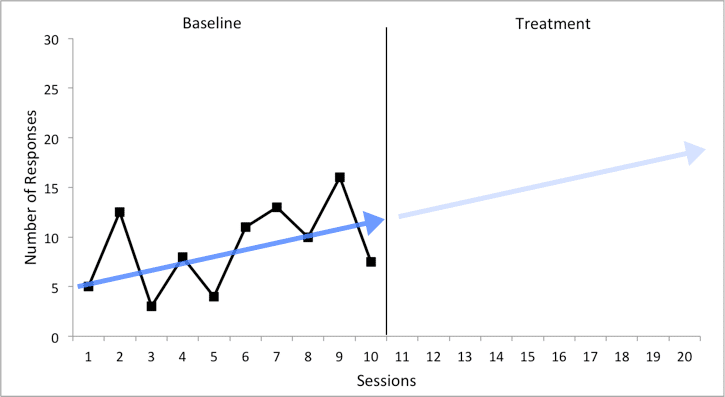
Now you’ll practice with graphs that have higher variability. Remember, you want to look at each phase and judge whether there is a slope in that phase that you can see above and beyond that variability. Let’s look at an example. You’ve been collecting baseline data on a student’s talk outs during science class. There’s a slight increasing slope in baseline. If you don’t implement an intervention, you would predict that the behavior would continue on this path.
Post a comment
This section is for the civil and public discussion of the content of this page. We reserve the right to moderate and remove comments that are irrelevant, disrespectful, hateful, harassing, threatening, or spamlike. If you are experiencing a technical issue, please contact our helpdesk for assistance.
