Lesson 2: Level Change
31 Topics
Lesson 3: Slope Change
45 Topics
Lesson 4: Putting It All Together
26 Topics
Mastering the Basics of Visual Analysis by Katie Wolfe and Timothy A. Slocum is © 2015-2024 FoxyLearning LLC and distributed under CC BY-NC-SA


; 2.2 Definition of Level
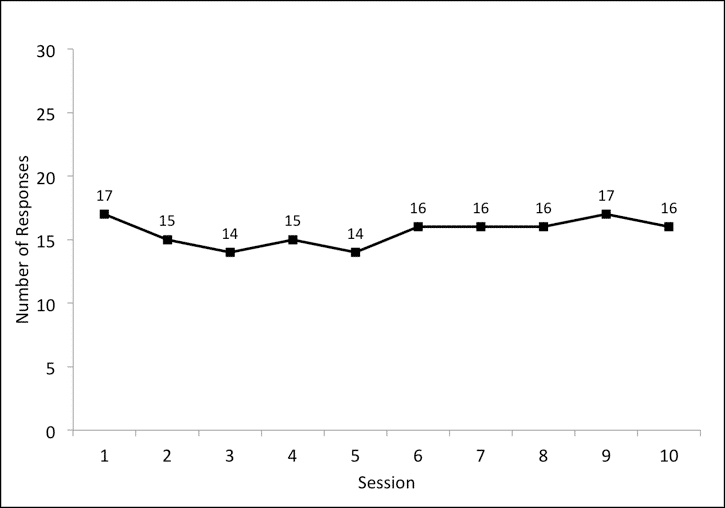
One way an intervention can affect a behavior is by changing its level. The level is the average height of the behavior within a phase. Let’s say that this graph shows the number of times my cat scratches the couch every day. Although the specific number of times changes a little bit every day, the level of her scratching is about 16. You can see this mathematically if you add up all of the data points and divide the total by the total number of data points. The average of them all is about 16. The level can be a good way to summarize the data within a phase.
Post a comment
This section is for the civil and public discussion of the content of this page. We reserve the right to moderate and remove comments that are irrelevant, disrespectful, hateful, harassing, threatening, or spamlike. If you are experiencing a technical issue, please contact our helpdesk for assistance.
