Lesson 2: Level Change
31 Topics
Lesson 3: Slope Change
45 Topics
Lesson 4: Putting It All Together
26 Topics
Mastering the Basics of Visual Analysis by Katie Wolfe and Timothy A. Slocum is © 2015-2024 FoxyLearning LLC and distributed under CC BY-NC-SA


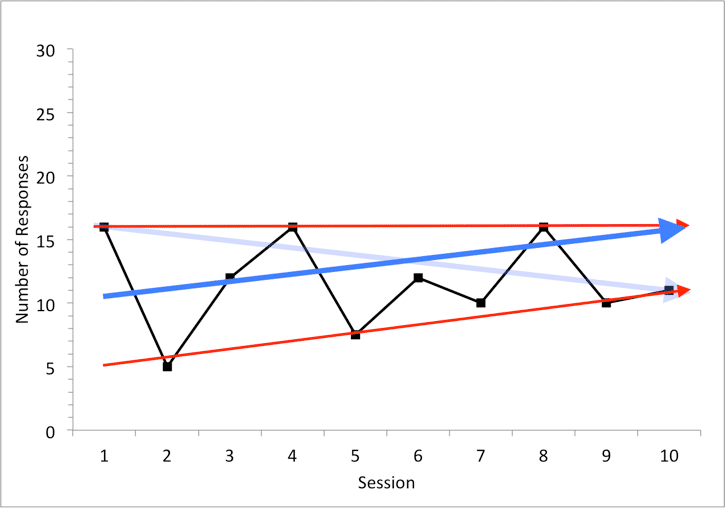
; 3.28 Estimating Slope with Variable Data Example #3: Adjust Angle of Original Slope Line
Post a comment
This section is for the civil and public discussion of the content of this page. We reserve the right to moderate and remove comments that are irrelevant, disrespectful, hateful, harassing, threatening, or spamlike. If you are experiencing a technical issue, please contact our helpdesk for assistance.
