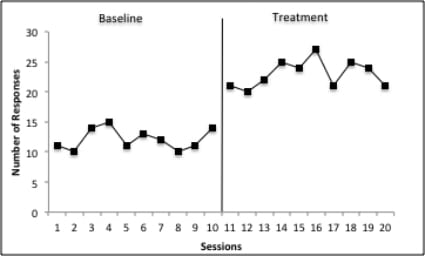
1.13 Graph the Data and Use Visual Analysis
I collect data every day for 10 days. This is what it looks like. It looks like spraying her DID change her behavior, but NOT in the direction I had hoped!
Basic Steps
Measure the behavior repeatedly in the baseline phase.
Implement the intervention and measure the behavior repeatedly in the intervention phase.
GRAPH the data and use VISUAL ANALYSIS to decide if the intervention caused a change in the behavior.

What a twist!