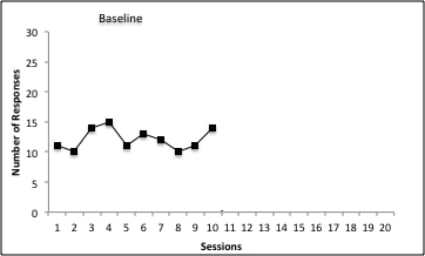
1.11 Measure Behavior During Baseline
Let’s look at a graph. This graph represents the number of times my cat scratches the couch. Remember that in baseline, I’m yelling at her every time she scratches the couch. This is what the data look like.
Basic Steps
Measure the behavior repeatedly in the baseline phase.
Implement the intervention and measure the behavior repeatedly in the intervention phase.
GRAPH the data and use VISUAL ANALYSIS to decide if the intervention caused a change in the behavior.

Unless you continue to yell and spray the cat, it would be hard to determine if the change in the cat scratching the couch was because you were no longer yelling or because you began spraying the cat with water.
Hi Rhea McMillan
Thanks for sharing, you are right that continuous behavior mentions the discipline. I do deep believe that implementing invention behavior and measure the behavior are not only help we see the progress, but also help us to notice where and when we need to change.
Have a good day!
Alice
“This is what the data look like”?