To provide the best experiences, we use technologies like cookies to store and/or access device information. Consenting to these technologies will allow us to process data such as browsing behavior or unique IDs on this site. Not consenting or withdrawing consent, may adversely affect certain features and functions.
The technical storage or access is strictly necessary for the legitimate purpose of enabling the use of a specific service explicitly requested by the subscriber or user, or for the sole purpose of carrying out the transmission of a communication over an electronic communications network.
The technical storage or access is necessary for the legitimate purpose of storing preferences that are not requested by the subscriber or user.
The technical storage or access that is used exclusively for statistical purposes.
The technical storage or access that is used exclusively for anonymous statistical purposes. Without a subpoena, voluntary compliance on the part of your Internet Service Provider, or additional records from a third party, information stored or retrieved for this purpose alone cannot usually be used to identify you.
The technical storage or access is required to create user profiles to send advertising, or to track the user on a website or across several websites for similar marketing purposes.

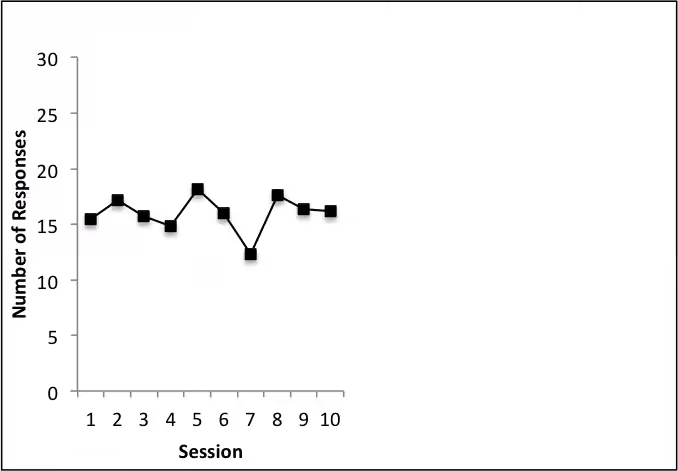
Based on the graph, we can see that the scratches raise up to 17times after first day yelling, drops to 14 times on the forth day. However, sharp up to 19 times on fifth, then sharp drops to 11 times on the seventh day. It backs to 18 times on the eighth day, and keep 16 times on the ninth and tenth. All in all, the average of scratches time even higher before the yelling treatment. We can see the yelling intervention does not help, so, we need to stop yelling and change the treatment.
You made a great observation! The fluctuations in the data clearly show that yelling isn’t reducing the scratching behavior, in fact, it seems to make it worse. I agree that it’s a good idea to stop the yelling and try a more positive or supportive intervention.
I totally agree too!
Looking at this graph it seems like the scratching behavior starts fairly high and continues to bounce around a lot even if yelling is happening. There is no clear decrease outside of session 7, which appears to be more of an outlier than a consistent change due to intervention implementation.
I agree, the scratching doesn’t consistently go down after the yelling, so it doesn’t seem to be helping. It would be better to try a different intervention.
I can predict that the cat is scratching roughly 15 times a day. Over the 10 days it is tracked, the behaviour went as high as 18 times on one day and as low as 12 times on day 7. Based on this baseline graph, I can predict that the scratching will not stop if I continue just yelling at the cat.
I agree! The cat’s scratching is generally fluctuating around 15 times per day, but it did increase slightly. However, it also decreased, the data was rather unpredictable.
Based on the graph, the cat is scratching is not very consistent and tends to bounce around a lot. Thus, the cat scratching treatment is likely not working. If the baseline continued, it would continue to bounce around unpredictably.
This example helped me understand how to describe baseline behavior. Instead of focusing on every single data point, we look at the overall pattern to describe what usually happens before the intervention begins.
yes it helped me as well understand.
based on the above graph, it seems like the scratching remains relatively unaffected by the yelling over the observation period. This information is helpful once we start the treatment and can observe whether the scratching increases, decreases or remains the same.
I noticed the scratching increased even after yelling was implemented as an intervention. It looks like the 7th session dropped to around 13, then rose fairly quickly after that.